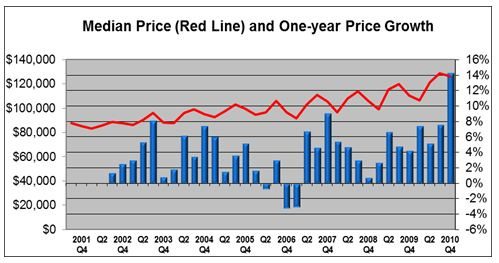
The housing market in Buffalo, New York performed remarkably well during one of the worst national markets in memory. Prices rose steadily over the last four years driven by strong fundamentals and a slow, steady pattern of growth. However, a pattern of slowing has developed in Buffalo’s fundamentals that may bring it back in line with the nation. Curious about Buffalo’s experience or looking for information on your own market? Local Market Reports for 154 metro areas are now available here and highlight trends through the 4th quarter of 2010.
More in-depth highlights from Buffalo after the jump.
Over the 3-year period ending in the 4th quarter of 2010, the median home price in the Buffalo metro area rose 20.0% to $126,500. This is very strong growth compared to the national figure, which declined by 18.2% over the same time frame. Over the four quarters ending in December, prices jumped 14.3%. However, even with the recent appreciation, the median home price in Buffalo is far below the national average of $169,800.
While historically low mortgage rates no doubt helped local affordability, Buffalo’s stability has its roots in the 1990s. Buffalo was hard hit by the recession of the early 1990s. The median home price rose from $80,000 in 1990 to just $80,100 by 2000. At the same time, Buffalo’s economy experienced a major structural shift. Beginning in the late 1990s, employment in Buffalo’s manufacturing sector drifted lower. The recession of 2001 accelerated this process as many jobs were exported, never to return. Simultaneously, Buffalo experienced tremendous growth in industries centered on education and health services as well and professional and business services. Other sectors slowed during the recent recession, but these sectors, which now make up a 16.8% and 13.3% of the local economy, respectively, held steady, even adding jobs in some cases. The diversification of Buffalo’s economy paid dividends in the recent recession as the unemployment rate in Buffalo peaked at 9.0% in February of 2009, well below the national peak of 10.1% in October of that same year. Buffalo’s unemployment rate has since fallen and stood at 8.2% in December.
Price growth and the relatively stable job market have enable Buffalo to weather the national foreclosure storm. Because affordability was so strong between 2000 and 2008, the debt-service ratio (the principle and interest divided by income) fell below its long-term average and was less than half the national average over that period, few buyers needed to use risky loans like ARMs or interest-onlys. Consequently, the local share of subprime loans in November of 2010 was just 1.6% and the foreclosure rate on prime loans was 1.59%, up from 1.27% six months earlier, but less than half the 3.35% national average for November.
However, housing markets and economies are cyclical. Fundamentals are still strong in Buffalo, but the 60-day and 90-day delinquency rates on prime loans both jumped in November of 2010. This trend suggests that the foreclosure rate on prime loans is likely to rise in the area this spring, creating pressure that will likely reign in local price growth.
Buffalo’s story is unique compared to the national housing market landscape. Local economic and housing dynamics fostered an environment of steady and stable growth over the last decade. Prices spiked recently, but an upward drift in delinquency rates may correct this later in the spring. Regardless, Buffalo’s economy is on the mend and local affordability is among the best in the country. Looking for another housing market? See any of NAR Research 154 Local Market Reports for highlights on markets across the country.


